Helios APIs: Observations (Search)
Using aggregations, we can summarize our search results in powerful ways
to identify trends that would not otherwise be apparent using the raw
observation data. When we use the time aggregation, the
API will return a list of time periods and the total number of observations
matching our query for each of those time periods.
In this example, we are going to look for roads with full snow coverage
in Colorado over a one month span. Our API query uses the state,
time_min, time_max, and sensors[road_weather]
query parameters:
https://api.helios.earth/v1/observations?state=colorado&time_min=2017-01&time_max=2017-02&sensors[road_weather]=10
This will return a list of individual observation points that we can
review. Instead of looking through all of this raw data, we are
going to append an aggs query parameter to aggregate the
results over time. The new query looks like this:
https://api.helios.earth/v1/observations?state=colorado&time_min=2017-01&time_max=2017-02&sensors[road_weather]=10&aggs=time&limit=0
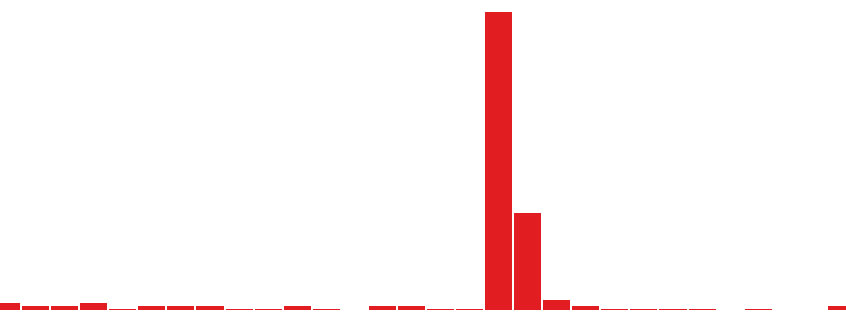
With the aggs=time query option, our API response now
returns the total number of observations in our time range that
had snow on the road, with the totals provided separately for each day.
We also specified a query option of limit=0 which
will tell the API not to return any of the raw point data. This step
is optional, but if you only care about the aggregation data, it will
help reduce the overall size of the API response.
With our new daily totals, we can begin to identify which days experienced the most severe weather events.